Functions and Features
Updated at: 2024/10/16
User Experience Diagnostics
Feature Overview
PulseDX's User Experience Diagnostics provides a quick and precise method to measure real visitor experience indicators (Google Lighthouse) across different regions, helping businesses gain clear directions to optimize website systems and design to meet global market demands more effectively, enhance search engine credibility, and attract more potential traffic opportunities.
Easy to Use PulseDX's User Experience Diagnostics
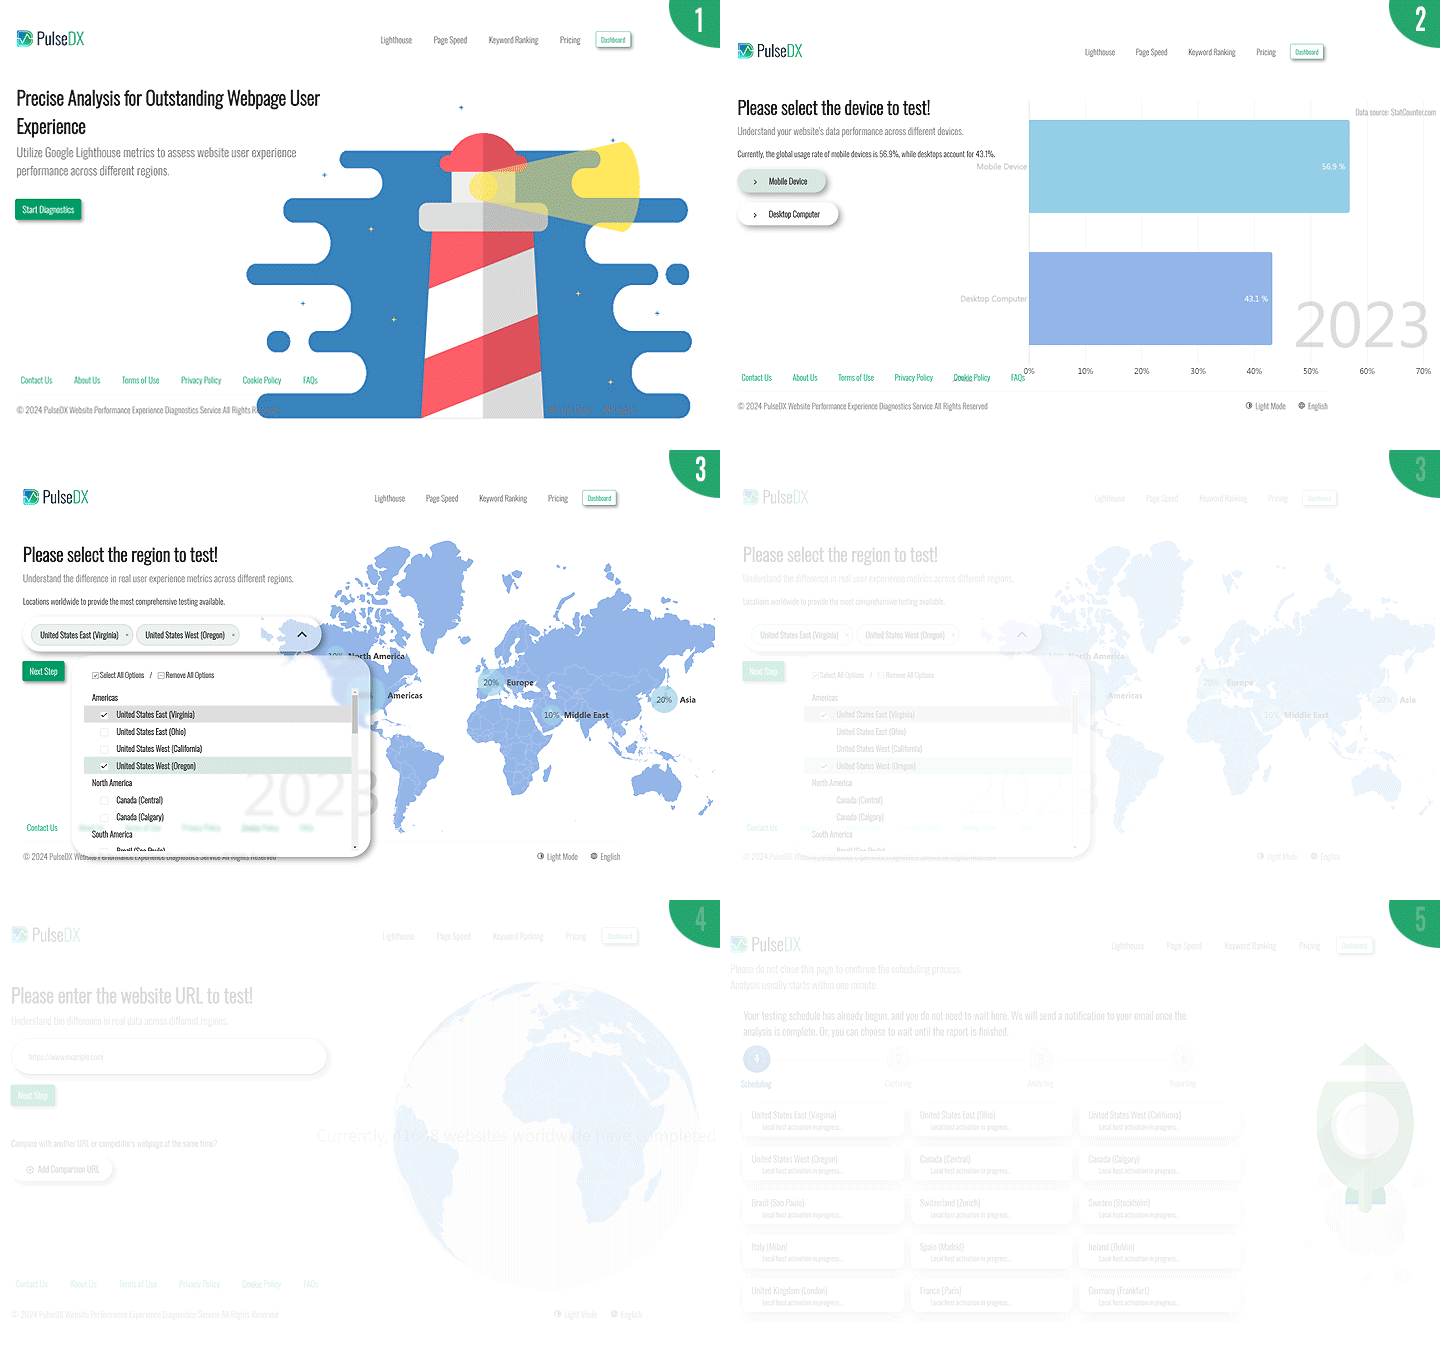
- Log in to the PulseDX.com platform and select "User Experience Diagnostics".
- Step 1: Choose the "Device" type, Mobile or Desktop.
- Step 2: Select the target "Country/Region".
- Step 3: Enter the "URL" to test, and optionally add "competitor URL" for comparison.
- Click "Next", and the system will automatically start the analysis and generate a report.
- Once the analysis is complete, a report link will be sent to your email.
Why Perform Website User Experience Diagnostics?
User experience indicators directly or indirectly affect user dwell time and conversion rates. Each country's market has different local devices and bandwidth conditions, and companies must optimize their websites for users in different countries to ensure smooth browsing experiences.
Overall, optimizing user experience helps businesses increase website attractiveness, enhance user satisfaction, and ultimately strengthen brand competitiveness in local markets.
Key Features of PulseDX User Experience Diagnostics
- View Real Experience Indicators in Different Regions: Users in different regions may face different connectivity conditions. Understanding these differences helps businesses target optimization efforts effectively.
- Understand Key Experience Metrics for Optimization: Quantitative user experience metrics help businesses better understand user needs and enhance brand loyalty.
- Competitor Analysis: Compare competitor website's user experience in different regions to identify competitive advantages or areas for improvement.
- Enhance Localization Strategies: Optimize localized website design and content to better meet local user expectations based on market needs.
- Share Diagnostic Reports: Share your actual diagnostic reports with key decision-makers without requiring them to register or log in.
- Long-term Scheduling and Tracking: Track website performance regularly to help businesses improve competitiveness and user satisfaction globally.
PulseDX User Experience Diagnostics Report - Understand Your Website's Real Performance Worldwide
With PulseDX's diagnostics report, you can easily understand the user experience metrics of your website or your competitors' websites across different regions and further view real metrics data and improvement suggestions for each country.
Global Overall Report
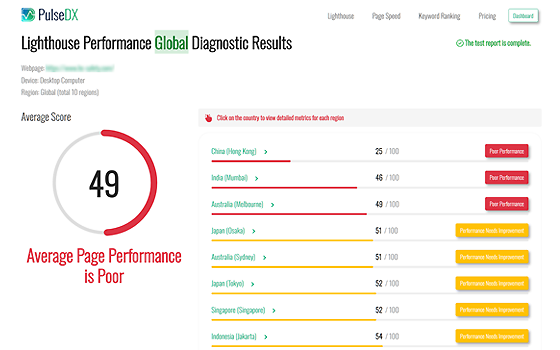
The report provides an overall average score for all selected regions and individual scores for each country. Click on the country you are most interested in to view detailed metrics.
Single Region Report
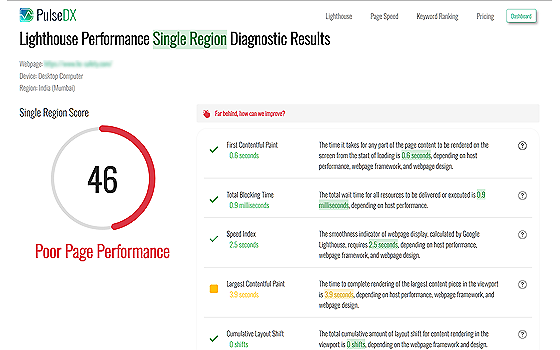
The report includes metrics such as First Contentful Paint (FCP), Total Blocking Time (TBT), Speed Index (SI), Largest Contentful Paint (LCP), and Cumulative Layout Shift (CLS) for each selected country. You can visualize gaps between each metric and standards, helping decision-makers understand issues and identify areas for improvement.
Improvement Suggestions
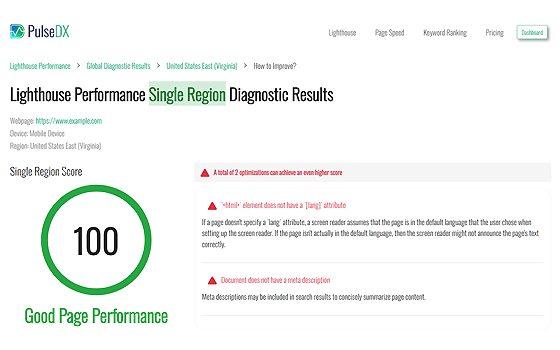
Specific suggestions are provided in the report, such as optimizing image sizes, reducing redirects, and improving server response times. These suggestions may require assistance from web design or related professionals to improve local user experience.
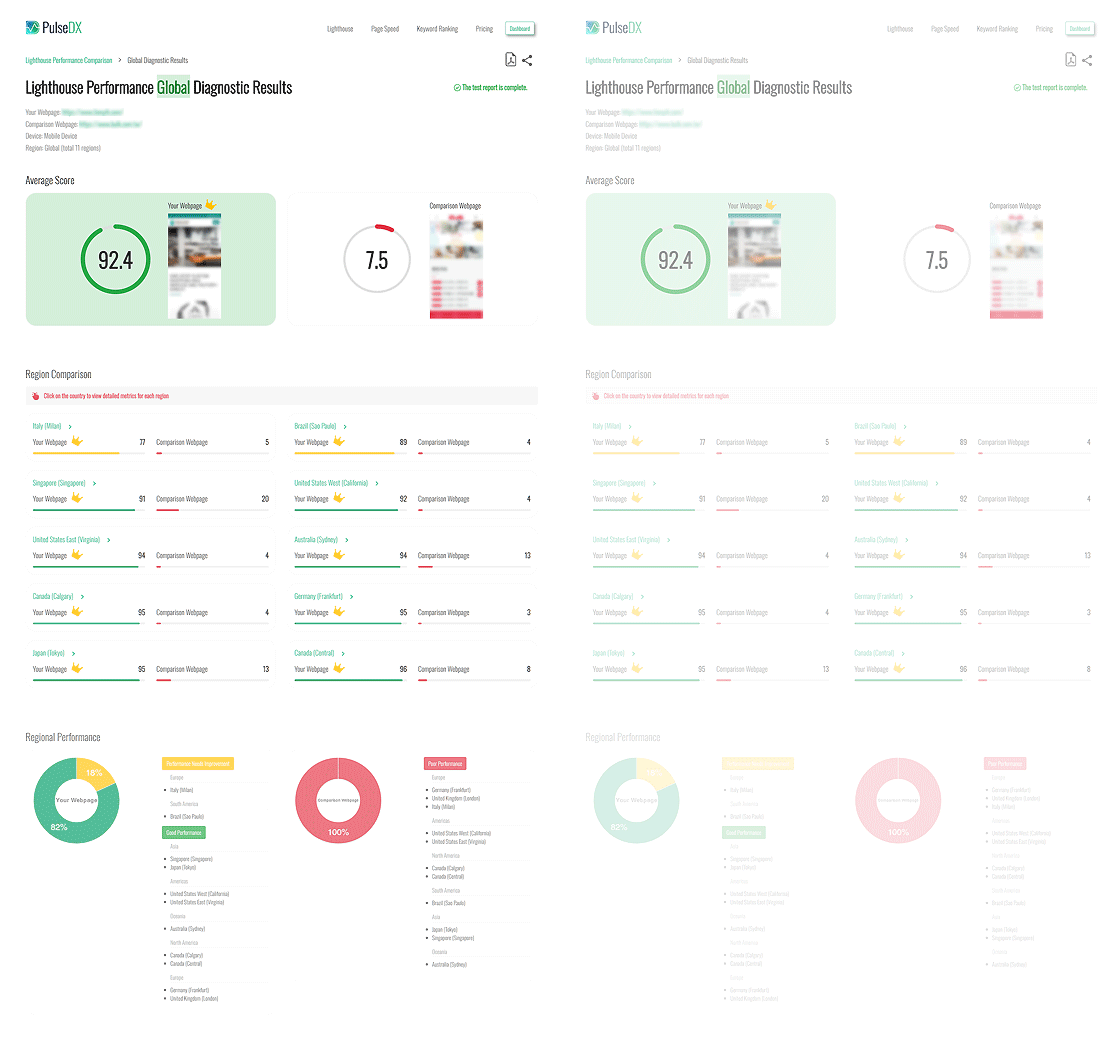
Competitor Comparison
Compare your Website's user experience metrics against competitors, helping you identify competitive advantages. You can compare individual countries to clearly understand whether your website performs better or worse locally.
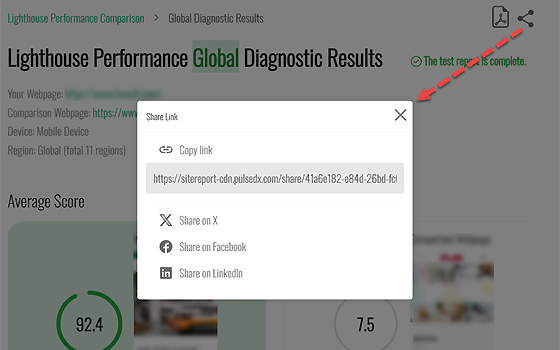
Share Reports
Create shareable links to provide decision-makers with easy access to the report without the need to register or log in. You can also post the shareable link directly on your preferred social media platforms.
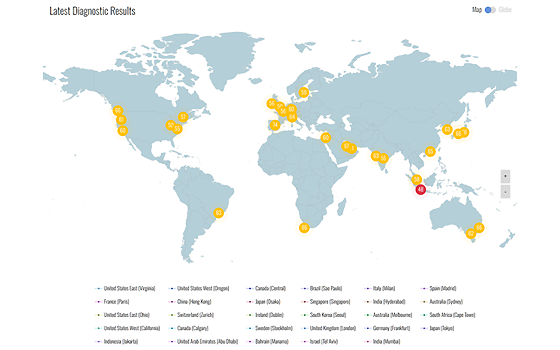
Long-term Tracking
Schedule diagnostics for a webpage to track changes in user experience metrics for regions you care about, enabling you to better cater to global market demands.
Pricing and Billing
The User Experience Diagnostics feature uses a credit-based billing model, with credits calculated based on the number of devices, regions, and URLs tested.
- The number of credits required varies depending on the selected devices, countries, and URLs.
- Members can subscribe to a diagnostics credit plan at any time. Accumulated credits will be deducted based on each diagnostics session's conditions, and the fee depends on the number of credits subscribed.
- Example of Diagnostics Conditions and Credit Calculation:
- (1) Conditions: 1 device x 3 regions x 2 URLs; the system will deduct 6 credits.
- (2) Conditions: 2 devices x 5 regions x 2 URLs; the system will deduct 20 credits.
For detailed pricing, please refer to the latest pricing table here